

Summary
With Dedicated Model Inference on the Together AI platform you can get your deployments to autoscale on metrics the inference engine actually understands, such as in-flight requests, TTFT, GPU utilization, token throughput. You can set replica bounds, pick a metric and target, and then tune two windows that control how eagerly it scales up and how patiently it scales down. Understanding and choosing the right metric is important because it determines how your deployment will behave under peaky traffic and impacts the latency your users will see. Below we'll cover how to choose the right metric to autoscale on and show an experiment where the same load was replayed under three different autoscale policies.
Over- and under-provisioning are both expensive
With dedicated inference you pay per replica-minute, which makes capacity planning a balance between two failure modes:
- Over-provision - you're paying for GPUs to sit at 15% utilization just so that you can handle the peak traffic when/if it arrives. Almost never viable, especially in the current GPU constrained environment.
- Under-provision - your p95 degrades sharply the moment traffic exceeds what your replicas can batch. LLM serving degrades nonlinearly: a replica at its concurrency limit doesn't get "a bit slower," it starts queueing, and TTFT can blow up from 200ms to 15s.
"Just autoscale it" is the obvious answer, and for stateless web services it mostly works. But LLM serving is a different beast and it breaks the two assumptions that classic autoscaling leans on:
- CPU-style metrics lie about load. A GPU can read 60% utilized while the engine's request queue is already backing up and utilization is measuring arithmetic intensity, not pressure. Scaling deployments on the wrong signal means that the system will respond to a number that doesn't describe the actual problem.
- Cold starts can take several minutes. A new replica has to be placed on a GPU node, pull tens of gigabytes of weights, load them into VRAM, and warm up. This means that you can't scale your way out of a spike because by the time it arrives it’s already too late to scale up. This then means that a good autoscaler's job is to act early on leading signals.
Due to these nuances and the varying requirements of each customer our platform gives you a catalog of inference-native metrics and allows you to choose how your deployment scales. This post helps you choose well!
How it works
Each deployment carries an autoscaling policy: replica bounds, one or more scaling metrics with targets, and timing windows.
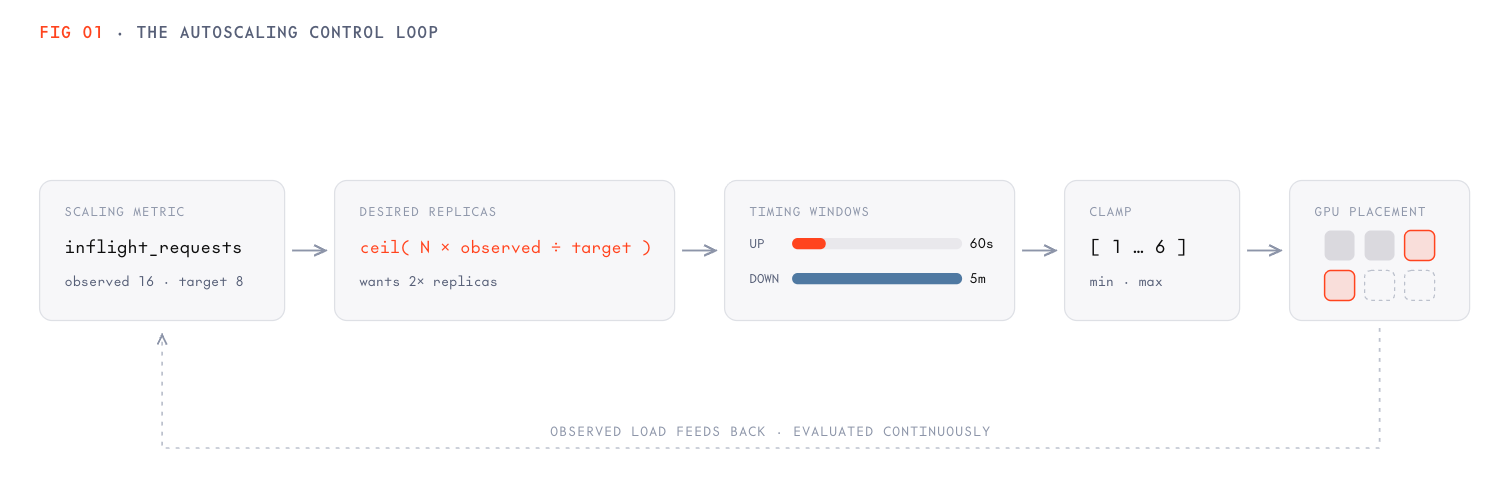
The control loop goes as follows: observed metric → desired replicas (ceil(N × observed/target)) → timing windows dampen → clamp to bounds → GPU placement. Observed load feeds back and the loop evaluates continuously with the traffic split following capacity automatically.
The core loop is proportional, meaning that if you target 8 in-flight requests per replica and you're observing 16, the system will want twice the replicas(assuming the 2x replicas are within the min, max bounds). The timing windows can be used to add a de-bouncing effect so that the replica count doesn't oscillate:
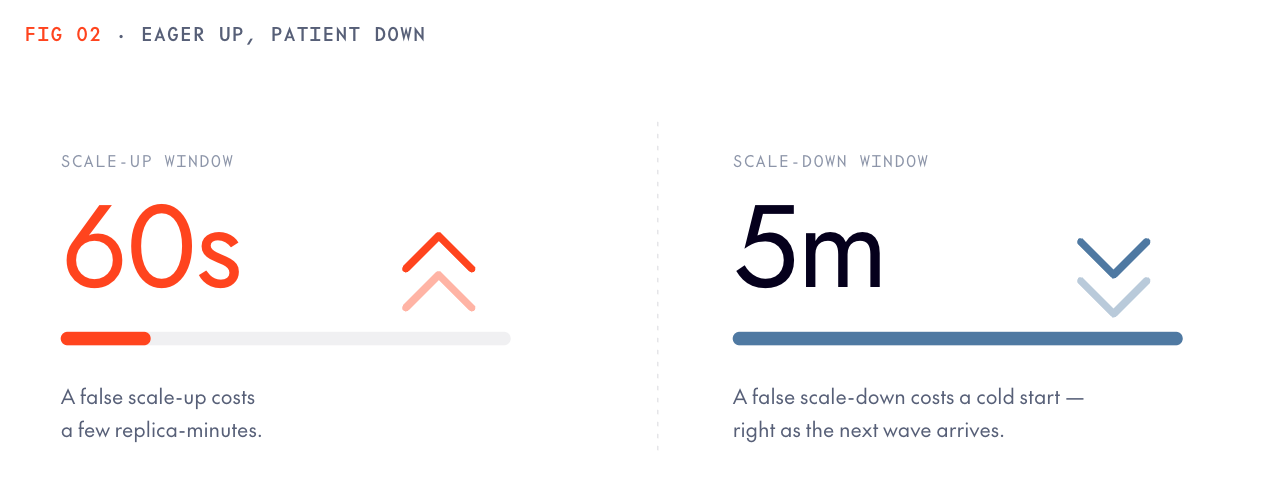
scale_up_window: how long the pressure must persist before adding replicas. Keep it short; the cost of a false scale-up is just a few replica-minutes, whereas the cost of a missed one is increased user-facing latency.scale_down_window(default 5m): how long things must stay calm before removing replicas. Keep it longer than your traffic's natural rhythm; the cost of a false scale-down could be a cold start right when the next peak arrives.
This asymmetric tradeoff of an eager up and patient down autoscale window is very important to tune and requires an intuitive understanding of your particular traffic distribution. Up-window mistakes cost dollars while down-window mistakes cost latency and dollars (because you'll just want to scale right back up, paying the cold start on the way back up).
Setting it is one PATCH:
A few settings to keep in mind:
min_replicas == max_replicas: this results in a fixed-size deployment, autoscaling is effectively off.- Setting both to
min_replicas = max_replicas = 0→ the deployment stops (stateSTOPPED, billing stops). This can be used as a way to pause your dev endpoint. - Giving a range turns scaling on; if you set bounds but no metric, the platform applies the default:
inflight_requestswith a target of 8.
Under the hood: metrics to autoscale on
Eight metrics that you can autoscale on. Picking the right one depends on what you're trying to protect your deployment against.

Autoscaling metrics include concurrency-driven (leading; the safe default), SLO-driven (trailing; scale on the promise), efficiency-driven (cost-first). If you attach multiple metrics the first one in the list is used.
Three ways to think about picking the right metric:
- Concurrency-driven (
inflight_requests) is a safe default. In-flight count is a leading indicator: it rises when demand outpaces service but before latency visibly degrades. This metric doesn’t need streaming or a percentile choice and it maps directly onto how engines batch requests. A target of 8 for this metric says "I want each replica handling about eight concurrent requests". You can raise it for short-prompt chat workloads that batch well, and lower it for coding agent long-context traffic that takes longer to prefill. - SLO-driven metrics (
ttft,e2e_latency): If your contract with users is "first token in under a second," scaling onttftp95 targets exactly this. Latency is a trailing signal which means that by the time p95 breaches the set threshold, users can already notice it, so you should typically pair a latency metric with honest headroom inmin_replicas. - Another thing to keep in mind is that per-token metrics need streaming traffic.
ttft,decoding_speed, andthroughput_per_replicaare only emitted on the streaming path. If your clients don't stream, these metrics have no data and you shouldn’t build your autoscale policy on them. (e2e_latencyis an exception because it's measured for streaming and non-streaming workloads). - Efficiency-driven (
gpu_utilization,token_utilization): squeezing the most out of your hardware. These optimize for cost: keep replicas busy, add capacity only when the fleet is genuinely saturated. When using these metrics you need to understand what "utilized" truly means for your workload. A GPU can be busy without the workload being latency-healthy, and utilization targets near 100% leave no headroom for arrival bursts. If you scale on utilization you should watch your p95 Grafana chart closely.
This is a good table to keep in the back of your mind when selecting the metric to scale on:
Idle shutdown and cold starts
There is no scale-to-zero-with-automatic-wake. min_replicas: 0 is legal only together with max_replicas: 0 which is a way to explicitly stop the deployment. Waking requires an explicit action and requests to a stopped deployment return an error rather than triggering a start. This means that you should plan dev and staging endpoints around auto-stop plus explicit restart windows.
The cold-start budget is important to understand when using this auto-stop functionality. You can think of a cold start as consisting of the following phases: GPU placement → weight download → engine load → warmup and the deployment's event feed timestamps each of these phases (pod.startup_phase_changed):
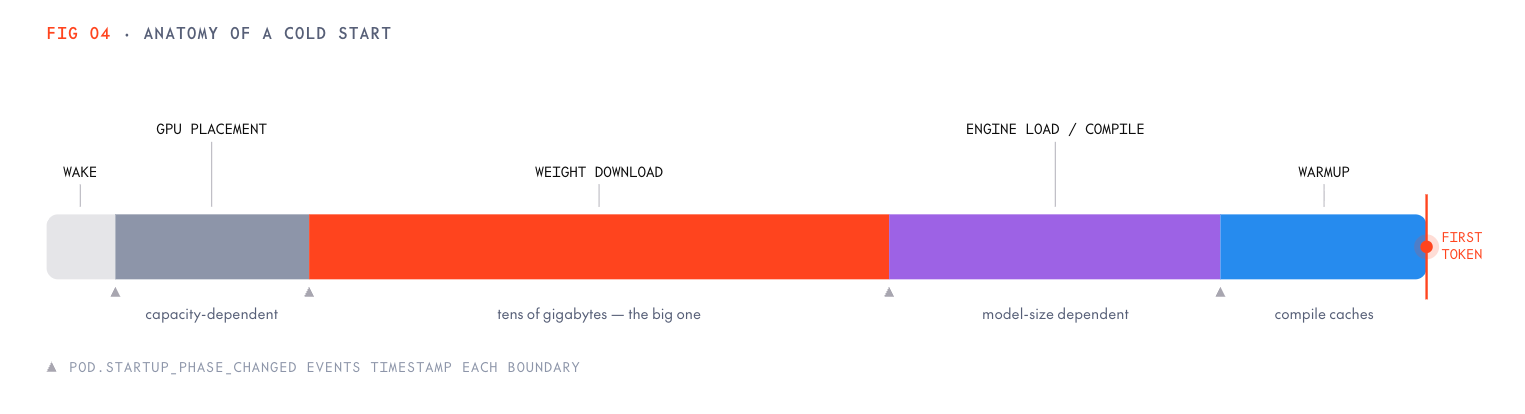
Larger models might have proportionally longer weight downloads, engine loads and warmup periods. To get a better feel for these numbers we present what we got across runs on 1×H100 replicas on warm clusters below:
Notice that these windows are measured in minutes which means that auto-stop only pays off when the gaps between uses are long relative to the restart and when the first user after an idle period is willing to tolerate an explicit start (or an error-then-retry flow). This tradeoff is okay for Dev and staging endpoints but for anything with a p95 SLO or unattended callers you should typically keep min_replicas: 1.
Edge cases
A spike arrives faster than a cold start. What actually happens?
Requests queue on existing replicas (the inflight_requests and engine queue depth will increase) and latency will degrade with TTFT increasing first followed by error/timeout risk while new replicas come up. This means that if your traffic can spike 10× in 90 seconds and your cold start is 4 minutes, the only defenses are min_replicas headroom or a higher-target policy that keeps slack capacity up. This is more of a capacity-shape question than a tuning question, and it's better answered before launch day.
Will my autoscaler fight a rollout?
No. While a rollout is in flight, the platform pins autoscaling bounds on both deployments; the rollout's replica counts would otherwise be undone by a scale-down decision mid-step. Your configured bounds are restored automatically when the rollout completes or aborts.
How does scaling interact with the traffic split?
This is handled smoothly because traffic-split weights are per ready replica (capacity = weight × ready replicas), a deployment that scales up automatically absorbs proportionally more traffic with no routing change. Autoscaling and routing work off the same capacity picture.
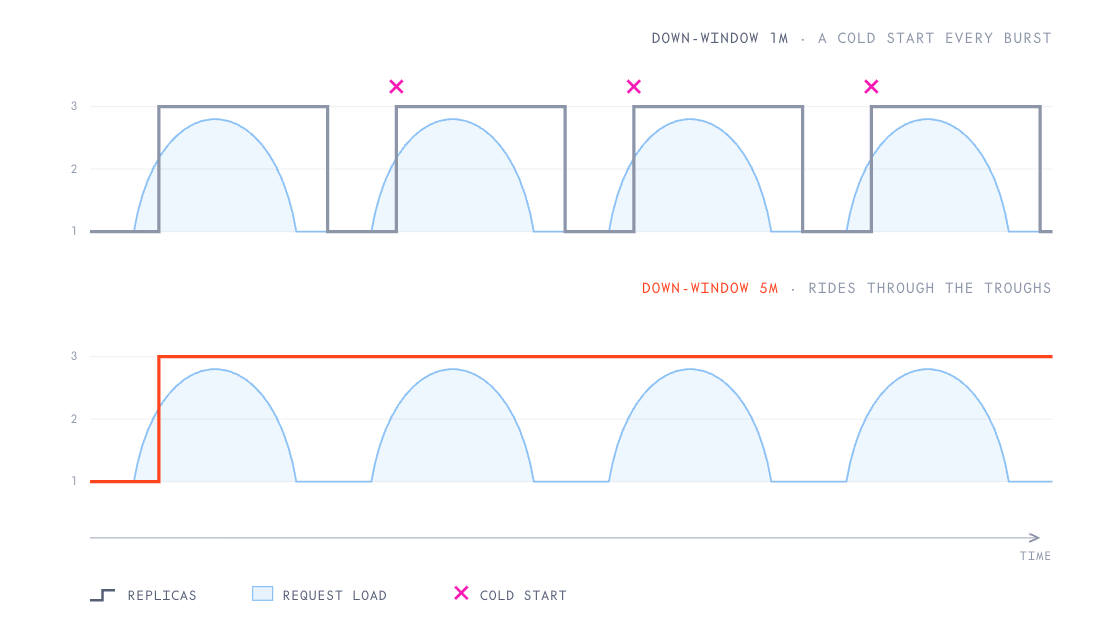
Why does my replica count look like a sawtooth?
This is the classic symptom of a scale-down window shorter than your traffic's natural rhythm. Bursty traffic + 1-minute down-window = scale down in every trough, cold start in every crest. To resolve this you should widen scale_down_window until the sawtooth flattens. This allows you to trade a few replica-minutes to eliminate repeated cold starts.
Autoscaling the same load with various policies
We ran this experiment on a Qwen3.5-9B deployment (1×H100 per replica, bounds 1–3), reset to exactly 1 replica before each round, then the same scripted load replayed three times: a sine wave between ~12 and ~48 RPS with two 80 rps spikes. This was repeated under three different autoscaling policies:
inflight_requeststarget 8ttftp95 target 300 msgpu_utilizationtarget 75%

Three lessons from the above runs:
- Only the concurrency signal fired. Client p95 ran at 3–5 seconds under this load and clearly saturated yet the
ttftpolicy never scaled, because engine-side time-to-first-token stayed low: continuous batching by the engine absorbs queue pressure into total latency, not first-token latency. Andgpu_utilizationnever scaled because short, bursty requests leave the GPU under its 75% bar. Both policies were reading signals that looked healthy while the system was saturated.inflight_requests, the direct queue-pressure signal was the only one that saw the problem and this is why it's the default. - Capacity helps exactly as promised. During the stretch where the inflight policy held 2 replicas (minutes ~6–11), its p95 runs visibly below the single-replica policies on the identical load and the middle panel shows the gap.
- Know your replica's saturation point before selecting a policy. One replica served 12–48 rps at 3–5s p95 without falling over but if you have a 500 ms SLO this would be a no-go.
Try it yourself!
Start with the defaults, then tune from evidence:
- Set real bounds (
min= what your base load needs,max= what your budget tolerates) and take the defaultinflight_requeststarget 8. - Watch a week of traffic in the metrics API: replica count, queue pressure, p95.
- Only then, tune: latency SLO → add a
ttftpolicy (if you stream); cost pressure → try utilization with honest p95 monitoring; sawtooth → widen the down-window.
📚 Docs: Dedicated Model Inference → Autoscaling